
Have you ever wondered how to decode the scrolling symbols on financial news channels? Learning to read a stock ticker is essential for anyone entering the investment world. This skill helps you track real-time market movements and make informed decisions about your portfolio.
Did you know the first stock ticker was invented in 1867 and could print about one character per second? Today’s digital stock tickers process thousands of transactions instantly. Understanding these symbols is your first step toward becoming a confident investor in today’s fast-paced financial markets.
KEY TAKEAWAYS:
- Stock tickers are unique symbols identifying publicly traded companies on exchanges.
- Ticker displays show real-time price, volume, and market activity.
- NYSE uses 1-3 character symbols while NASDAQ uses 4-5 characters.
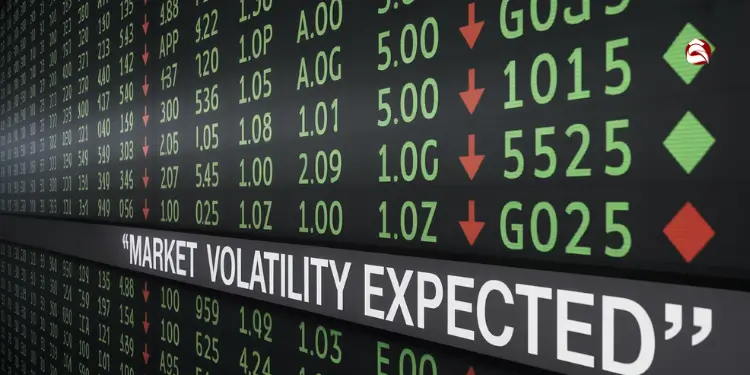
- Color coding indicates price direction (green for up, red for down).
- Special suffixes indicate share classes or corporate actions.
- Practice with simulators helps build confidence in reading tickers.
What is a Stock Ticker?

A stock ticker is a unique symbol or code used to identify a publicly traded company on a stock exchange. It displays real-time information about a stock’s price, trading volume, and market activity. This electronic stream of data helps investors track and analyze market movements instantly.
Components of a Stock Ticker
The stock ticker is an electronic display of stock market activity, showing the ticker symbol, the stock price, and trade information for a specific stock. Each company listed on an exchange has a unique ticker symbol, an abbreviation that represents the company’s stock. The ticker tape streams this information, providing a continuous update on how a stock trades.
A stock ticker display consists of four essential components: the ticker symbol (1-5 letter code), current price per share, price change from previous close, and trading volume – all presented in a compact real-time format that updates continuously throughout the trading day. Ref.: “Investopedia Editorial Team (2023). How To Read A Stock Ticker. Investopedia.” [!]
how to read stock ticker
To read a stock ticker effectively, focus on the company’s ticker, its stock price, and the price change since the last trade. If you’re researching a new stock, you’ll see the company’s ticker followed by the stock price. The ticker also shows the price change, indicating whether the stock price has increased or decreased. This helps to read stocks and assess its current market position.
Types of Stock
Stocks represent ownership in a company and come in various forms. Understanding the different types helps investors make informed decisions based on their financial goals and risk tolerance.
- Common Stocks
- Preferred Stocks
- Growth Stocks
- Value Stocks
- International Stocks
- Dividend Stocks
- Small-Cap Stocks
- Large-Cap Stocks
- Blue-Chip Stocks
Common Stocks vs. Preferred Stocks
Stocks are primarily categorized into common and preferred types, each offering distinct benefits and characteristics to investors.
| Feature | Common Stocks | Preferred Stocks |
|---|---|---|
| Voting Rights | Yes, typically one vote per share | Usually no voting rights |
| Dividends | Variable, not guaranteed | Fixed, higher priority |
| Price Volatility | Higher volatility | Lower volatility |
| Capital Appreciation | Higher potential | Limited potential |
| Claim on Assets | Last in line during liquidation | Higher priority than common |
| Convertibility | Not convertible | Often convertible to common |
Growth Stocks vs. Value Stocks
Investors often classify stocks based on their growth potential and current valuation relative to their intrinsic worth.
| Feature | Growth Stocks | Value Stocks |
|---|---|---|
| Focus | Future earnings potential | Current undervaluation |
| P/E Ratio | Higher P/E ratios | Lower P/E ratios |
| Dividends | Little to no dividends | Often pay regular dividends |
| Risk Level | Higher risk, higher reward | Lower risk, steady returns |
| Company Stage | Expanding rapidly | Established, stable |
| Investor Profile | Long-term, aggressive | Conservative, income-focused |
International Stocks
International stocks are stocks of companies based outside of your domestic market. Trading international stocks can diversify a portfolio, but requires an understanding of different market regulations and company’s ticker conventions. Investors can read stocks even if it is an international stock, assuming that they understand the stock ticker in that country.
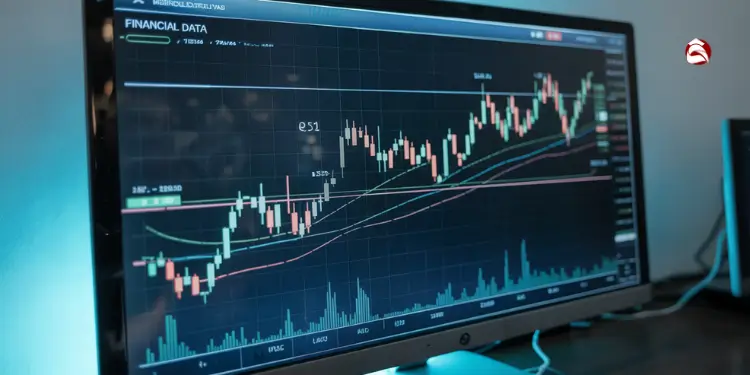
Reading Stock Charts
Reading stock charts is essential for analyzing price movements and making informed investment decisions. By understanding chart patterns and indicators, investors can identify trends and potential entry or exit points for trades.
- Identify the time frame (daily, weekly, monthly)
- Locate the price axis and volume indicators
- Look for trend lines (upward, downward, sideways)
- Identify support and resistance levels
- Check for chart patterns (head and shoulders, double tops/bottoms)
- Analyze volume alongside price movements
- Consider technical indicators (moving averages, RSI, MACD)
“Read more: Financial Goals vs Investment Goals Differences Explained“
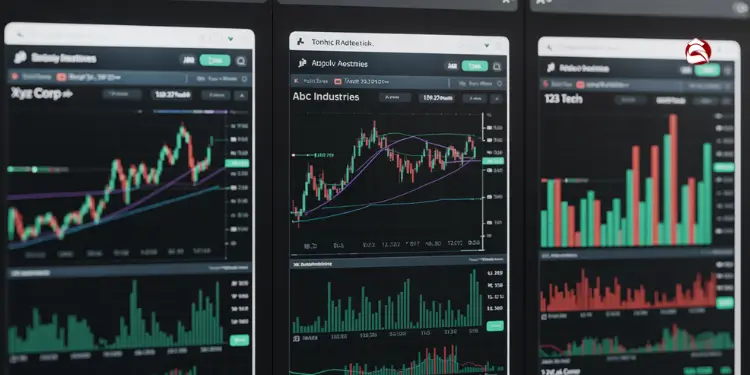
Types of Stock Charts
Different chart types offer various ways to visualize stock price data, each providing unique insights into market behavior. Investors choose chart types based on their analysis needs and trading strategies.
- Line Charts
- Bar Charts
- Candlestick Charts
- Point and Figure Charts
- Renko Charts
- Heikin-Ashi Charts
- Volume Charts
- Tick Charts
“read more: Saving vs Investing for Financial Goals Explained“
Interpreting Stock Chart Data
Interpreting stock chart data involves understanding key elements like trends, support and resistance levels, and trading volume. By analyzing these factors, investors can gain insights into potential future price movements. The stock chart is very important to understand as it visually shows how a stock has traded, including the highest and lowest prices the stock has traded.
What is Ticker Tape?
The ticker tape is a continuous electronic display of real-time stock market data, showing each trade and the corresponding stock price. Understanding ticker tape is essential to read stocks and the ticker tape can provide quick updates on market activity. It displays the ticker symbol, the number of shares traded, and the price change.

Understanding Market Data
Market data encompasses a broad range of information, including stock prices, trading volume, and price change, essential for understanding the stock market. This data is crucial to read stocks and understanding stock tickers, informing investors about potential investment opportunities. Access to reliable market data helps investors make informed decisions about their stock trades.
Using Market Data to Inform Decisions
Using market data effectively involves analyzing stock prices, trading volume, and price change to make informed investment decisions. Investors can read stocks and understand how a particular stock is performing compared to its peers. Market data is an important part of any strategy and investors should regularly read stock market data.
Essential Terminology: Basics of Stock Trading
Understanding the fundamental terminology of stock trading is crucial for navigating the financial markets effectively. These terms form the foundation of investment knowledge and enable investors to communicate, analyze, and make informed decisions with confidence.
| Term | Definition | Importance | Example |
|---|---|---|---|
| Stock Symbol | Unique abbreviation representing a company on exchanges | Essential for identifying and trading specific stocks | AAPL for Apple Inc. |
| Stock Price | Current market value of one share | Indicates company valuation and market sentiment | $150.25 per share |
| Dividend | Payment made by company to shareholders | Provides income and signals financial health | $0.82 per share quarterly |
| Market Cap | Total market value of company’s outstanding shares | Helps assess company size and investment risk | $2.5 trillion |
| P/E Ratio | Price-to-earnings ratio comparing price to earnings | Measures valuation and growth expectations | 25.5 |
| Volume | Number of shares traded during a period | Indicates liquidity and market interest | 50 million shares |
| Bid/Ask | Highest price buyer will pay / lowest price seller will accept | Determines trade execution and spreads | Bid: $150.20, Ask: $150.25 |
| Bull Market | Period of rising stock prices | Influences investment strategy and timing | S&P 500 up 20%+ |
| Bear Market | Period of falling stock prices | Affects risk management and portfolio allocation | S&P 500 down 20%+ |
Basic Analysis Techniques
Basic analysis techniques involve studying stock charts and financial statements to evaluate a company’s financial health and potential growth. Investors read stock charts to identify trends and patterns in stock prices. Investors read stocks in order to determine whether a stock is a good investment.
Tools for Reading Stocks
Modern investors rely on specialized tools to analyze stocks, track markets, and make informed decisions. Below is a categorized list of essential resources, each with a direct link and a concise explanation of its purpose:
1. Brokerage Platforms
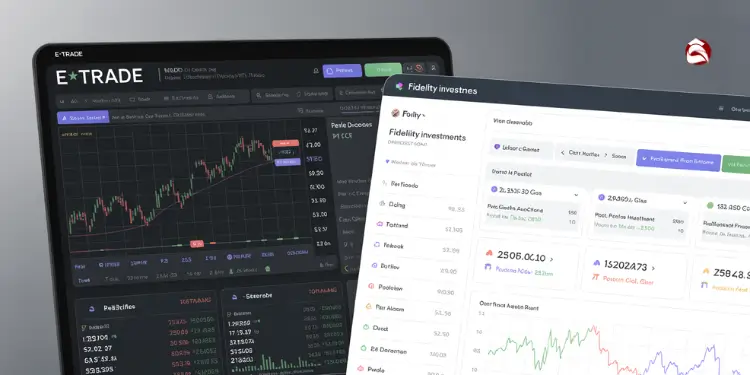
- E*TRADE: User-friendly trading with advanced tools and real-time data.
- Fidelity: Comprehensive investment platform with research and retirement planning.
2. Financial News Websites
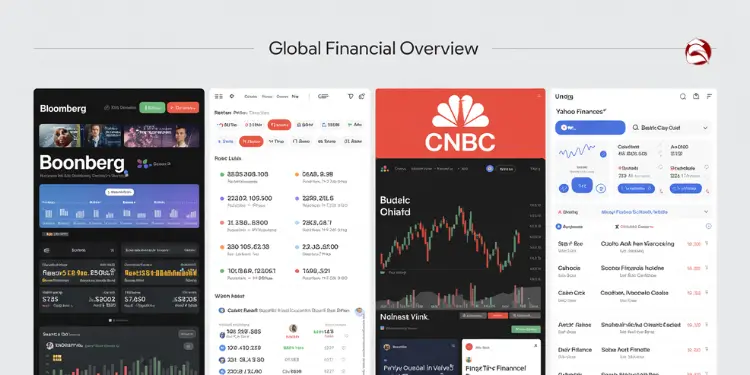
- Bloomberg: Global financial news, data, and analysis.
- Reuters: Real-time market updates and investigative journalism.
- CNBC: Business news, stock insights, and expert commentary.
- Yahoo Finance: Free market data, portfolios, and customizable watchlists.
3. Stock Chart Analysis Software
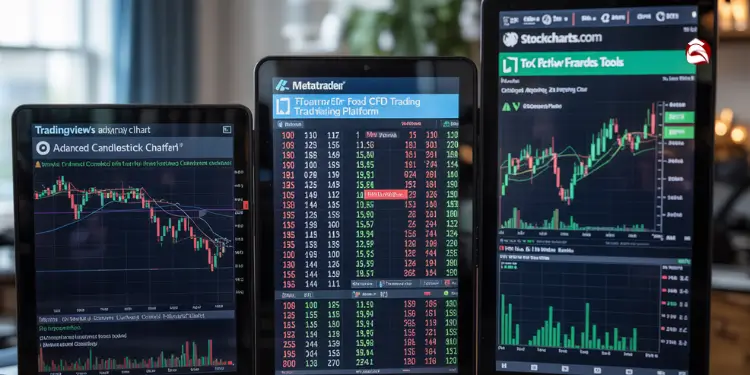
- TradingView: Advanced charts, indicators, and social trading features.
- MetaTrader: Popular for forex/CFD trading with automated options.
- StockCharts.com: Technical analysis tools and custom scans.
4. Market Data Providers
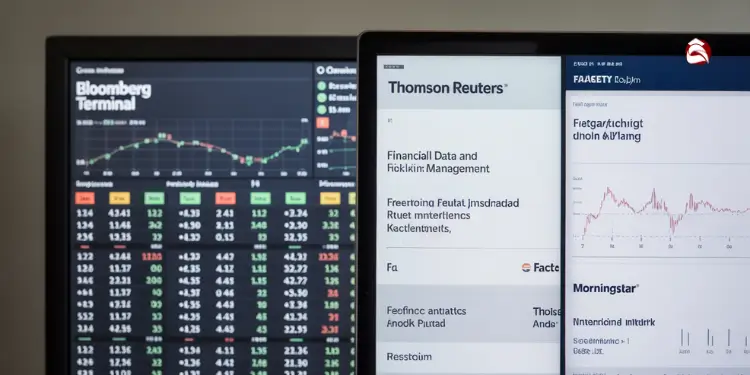
- Bloomberg Terminal: Enterprise-level real-time data and analytics.
- Thomson Reuters: Financial data, news, and risk management solutions.
- FactSet: Integrated analytics for investment professionals.
- Morningstar: Independent research, ratings, and portfolio tools.
5. Stock Screeners
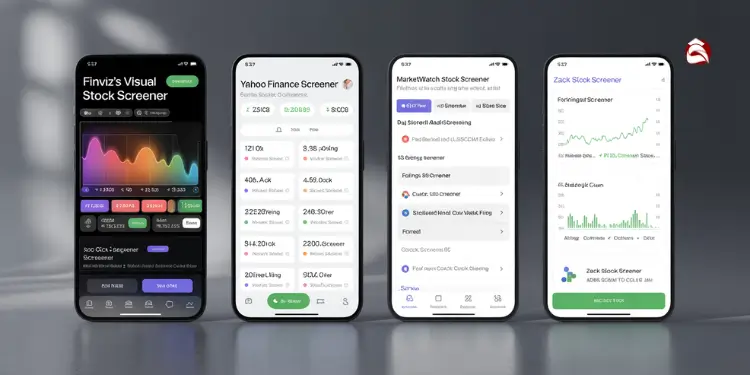
- Finviz: Visual screener with customizable filters and heatmaps.
- Yahoo Finance Screener: Free tool to filter stocks by fundamentals/technicals.
- MarketWatch Stock Screener: Pre-defined and custom screening options.
- Zacks Stock Screener: Focus on earnings and growth metrics.
6. Portfolio Trackers
- Mint: Budgeting and investment tracking in one dashboard.
- Yahoo Finance Portfolio: Free tracking and performance analysis.
- Morningstar Portfolio Manager: In-depth portfolio X-ray and fee analysis.
7. Economic Calendars
- Investing.com Economic Calendar: Global events with impact filters.
- Forex Factory: Forex-focused events and volatility indicators.
- Bloomberg Economic Calendar: Key economic releases and central bank events.
- DailyFX: Event-driven market analysis.
8. Mobile Trading Apps
- Robinhood App: Intuitive mobile-first trading experience.
- Webull App: Advanced tools and extended-hours trading.
- Fidelity Mobile App: Full-featured platform for trading and research.
Decode basic ticker anatomy quickly
Understanding stock ticker anatomy is essential for beginners to quickly interpret market data. A basic ticker displays the company symbol, current price, price change, and volume – all in a compact format that updates in real-time.
Ticker letters segmentation key rules
Ticker letters segmentation follows key rules where each ticker symbol represents a unique company listed on an exchange like the New York Stock Exchange. Generally, the company’s ticker is an abbreviation of the company’s name, making it easier to identify. For example, Apple’s stock has the stock symbol AAPL.
Common abbreviations new investors encounter
New investors often encounter various abbreviations when reading stock tickers and market data. These symbols provide condensed information about a stock’s performance and characteristics, helping investors make quick decisions without wading through lengthy reports.
| Symbol | Explanation |
|---|---|
| AAPL | Apple Inc. – Company ticker symbol |
| $150.25 | Current stock price per share |
| +2.15 | Price change from previous close |
| +1.45% | Percentage change from previous close |
| Vol | Volume – Number of shares traded |
| Div | Dividend – Annual dividend per share |
| P/E | Price-to-earnings ratio |
| Mkt Cap | Market capitalization – Total company value |
| 52W H | 52-week high price |
| 52W L | 52-week low price |
| EPS | Earnings per share |
| Beta | Measure of stock volatility relative to market |
| YTD | Year-to-date performance |
| Open | Opening price for current session |
| Close | Previous day’s closing price |
Identify exchange letters and suffixes
Stock ticker symbols often include special letters or suffixes that indicate important information about where or how a stock trades. These identifiers help investors quickly understand the exchange, market tier, or special status of a security without additional research.
| Suffix/Letter | Explanation |
|---|---|
| .PK | Pink Sheets – Over-the-counter market with minimal regulation |
| .OB | OTC Bulletin Board – Over-the-counter market with reporting requirements |
| .A | Class A shares – Different voting rights or dividend structure |
| .B | Class B shares – Different voting rights or dividend structure |
| .U | Units – Typically represents a bundle of securities |
| .WS | Warrants – Securities giving the right to buy stock at a set price |
| .WI | When-Issued – Stock that has been announced but not yet issued |
| .PR | Preferred stock – Priority in dividends and liquidation |
| .RT | Rights – Short-term securities offering existing shareholders first chance to buy new shares |
NASDAQ versus NYSE symbol length
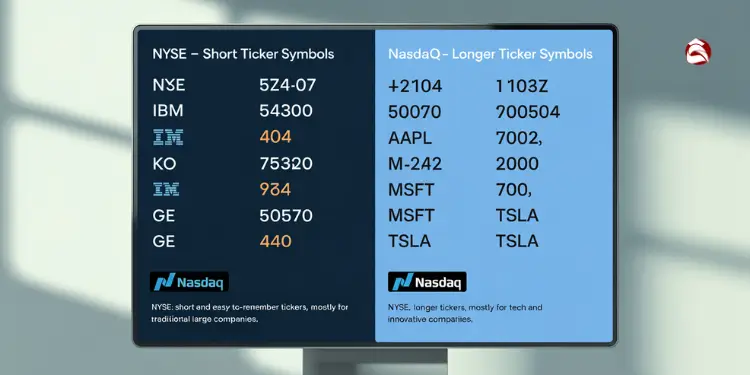
The two major U.S. stock exchanges have distinct conventions for ticker symbols that help investors quickly identify where a company trades. These differences in symbol length and structure reflect each exchange’s historical development and listing requirements.
| Feature | NASDAQ | NYSE |
|---|---|---|
| Typical Length | 4-5 characters | 1-3 characters |
| Symbol Examples | AAPL, MSFT, GOOGL | BRK.A, JPM, V |
| Historical Reason | Needed more symbols as tech companies grew | Older exchange with shorter tradition |
| Special Cases | Can include 5th letter for special situations | May include periods for share classes |
| Listing Focus | Technology and growth companies | Traditional and established companies |
| Symbol Uniqueness | All symbols are unique within NASDAQ | All symbols are unique within NYSE |
NYSE typically uses 1-3 character ticker symbols for established companies, while NASDAQ uses 4-5 characters, reflecting their historical development – NYSE as the older exchange with shorter tradition and NASDAQ needing more symbols as technology companies grew. Ref.: “SmartAsset Editorial Team (2023). NASDAQ vs NYSE: Key Differences. SmartAsset.” [!]
Spot price movement flashes in real time
Understand green up red down flashes
On the stock ticker, price movements are often indicated by color-coded flashes. Green usually signifies an increase in the stock price compared to the previous trade, while red indicates a decrease. These flashes allow investors to quickly see whether a particular stock price is rising or falling. These flashes are very important to read stock price data.
Color conventions for stock price movements vary by international market – while U.S. markets use green for price increases and red for decreases, some international markets may reverse these colors, requiring investors to verify local market conventions when trading globally. Ref.: “Koh, M.A. (2023). The meaning of colors in the stock market. AnnaKoh.com.” [!]
Interpret last trade price and change
The last trade price on the stock ticker shows the price at which the most recent stock trade occurred. The price change indicates how much the price has moved up or down from the previous day’s closing price. Analyzing both the last trade price and the price change provides a snapshot of the company’s stock current performance. These things are very important to reading stock movements.
Monitor volume alerts for liquidity
Volume alerts indicate a significant number of shares being traded for a particular stock. A high volume suggests high liquidity, making it easier to buy or sell shares without significantly impacting the stock price. Monitoring these alerts helps investors assess the market interest in a stock and its potential for price movement. This helps in reading stock and market data.
“Related Articles: Examples of Common Investment Goals for Beginners“
Distinguish shares classes and corporate actions
Companies may issue different classes of shares with varying rights and privileges, while corporate actions like splits and mergers can significantly impact stock symbols and prices. Understanding these distinctions is crucial for investors to accurately interpret ticker information and make informed decisions about their investments.
| Share Class/Corporate Action | Key Characteristics | Impact on Ticker | Investor Implications |
|---|---|---|---|
| Class A Shares | Typically have voting rights, often higher price | Usually ends with .A or no suffix | More control over company decisions |
| Class B Shares | Often fewer or no voting rights, lower price | Usually ends with .B | Less control but potentially more affordable |
| Class C Shares | No voting rights, created for specific purposes | Usually ends with .C | Pure investment without governance rights |
| Stock Split | Increases shares outstanding, decreases price proportionally | May add temporary .S or similar suffix | More affordable shares, same market cap |
| Reverse Split | Decreases shares outstanding, increases price proportionally | May add .R or similar suffix | Higher per-share price, reduced share count |
| Merger/Acquisition | Company combines with another | Ticker changes to new company symbol | New ownership structure, potential synergies |
| Spin-off | Company separates into independent entities | New ticker created for spun-off company | Separate investment with focused business |
| Dividend | Cash or stock distribution to shareholders | May show .D or similar on ex-dividend date | Income generation or additional shares |
Corporate actions including stock splits, mergers, and dividend distributions significantly impact ticker symbols and require careful monitoring – these events can change trading symbols, adjust share quantities, and affect investment valuations without changing overall market capitalization. Ref.: “FINRA Investor Education (2023). Corporate Actions by Public Companies—What You Should Know. FINRA.org.” [!]
Practice reading sample tickers with tools
- Start by selecting a reliable financial website or trading platform that displays real-time stock tickers, such as Yahoo Finance, Google Finance, or your brokerage account’s dashboard.
- Choose 3-5 well-known companies with different ticker lengths (like AAPL, MSFT, BRK.A) to observe how symbols vary by exchange and company type.
- Watch the ticker for 5-10 minutes, noting how prices change, the color coding (green for up, red for down), and the speed of updates.
- Use a stock simulator to practice interpreting ticker information without financial risk, making virtual trades based on your readings.
- Test your knowledge by covering the company name and trying to identify the business solely from its ticker symbol and current market data.
- Gradually increase the number of tickers you monitor simultaneously, building your ability to quickly scan and interpret multiple streams of market information.
- Keep a journal of ticker symbols you’ve learned, noting any patterns or suffixes that indicate special share classes or corporate actions.
Free simulators track practice progress
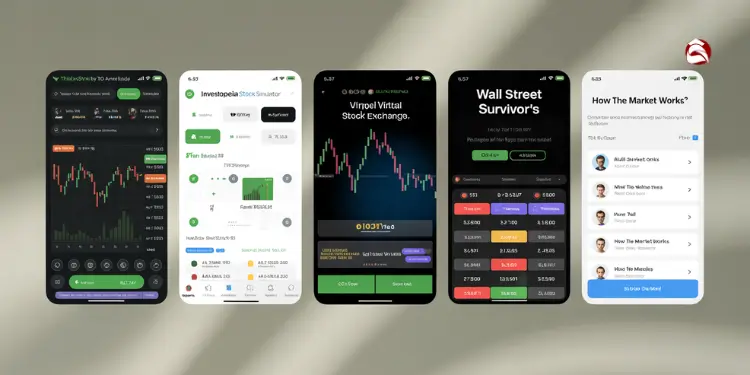
Stock market simulators provide an excellent risk-free environment for beginners to practice reading stock tickers and developing trading strategies. These virtual trading platforms offer real-time market data, allowing users to track their progress, learn from mistakes, and build confidence before investing real money.
- Thinkorswim by TD Ameritrade – Professional-grade platform with paper trading, advanced charting, and educational resources
- Investopedia Stock Simulator – User-friendly simulator with real-time data, portfolio tracking, and competitive trading games
- MarketWatch Virtual Stock Exchange – Comprehensive simulator with customizable games, real-time quotes, and detailed performance reports
- Wall Street Survivor – Educational platform combining simulator with courses, articles, and trading contests
- How The Market Works – Beginner-friendly simulator with lesson plans, quizzes, and real-time trading practice
Stock market simulators provide beginners with essential risk-free practice environments, allowing users to develop investing skills, understand market mechanics, and build confidence before committing real capital to actual trading scenarios. Ref.: “Investopedia Editorial Team (2023). Develop Your Skills With Simulated Trading. Investopedia.” [!]
A stock ticker is a unique symbol code that identifies publicly traded companies on exchanges, displaying real-time information about stock prices, trading volume, and market activity. Understanding how to read these tickers is essential for tracking market movements and making informed investment decisions.
Ticker symbols vary by exchange—NYSE typically uses 1-3 characters while NASDAQ uses 4-5 characters—and include color-coded price movements (green for up, red for down) and special suffixes indicating share classes or corporate actions. Mastering ticker anatomy enables investors to quickly assess market conditions and liquidity.


