
When interest rates go up, your power to buy a home drops fast. The price you see is just part of it. The real story is in the monthly payment.
A 1% rate increase can cut your buying power by $40,000 or more. This is for a typical mortgage.
The National Association of Realtors says there’s now a 3.5-month supply of homes. Yet, many homeowners with low rates don’t want to sell. “Today’s buyers face a perfect storm of high prices and elevated borrowing costs,” says Dr. Melissa Chen.
I’ve seen many Greenville families adjust their plans when they see their mortgage figures. The price-to-income ratio from 2021 doesn’t work today. The average ratio is now 4.5 nationwide.
The housing market needs careful planning now more than ever. When payments go up faster than income, buyers must change their plans for owning a home.
Quick Hits:
- Each rate point reduces buying power
- Low-rate homeowners reluctant to move
- Monthly payments matter more than price
- Pre-approval before house hunting essential
- Budget calculations need regular updates
Unsold inventory sits at just a 3.5-month supply—well under the six-month level that signals a balanced market—confirming ongoing seller-market conditions nationwide.Ref.: “National Association of REALTORS® Research Group. (2025). Existing Home Sales Supplemental Data, April 2025. National Association of REALTORS®.” [!]
Explaining mortgage interest rate components
Every mortgage rate quote has a special formula. Lenders use this formula to figure out how much you’ll pay to borrow money. When you see a rate like 6.5%, it’s not just a random number. It’s based on the market, the lender, and your financial situation.
Knowing these parts helps you get better deals. You could save thousands over the life of your loan.

Base Rate Lender Margin Explained
The base rate is the starting point for your mortgage rate. It’s usually tied to the 10-year Treasury bond yield. This bond is a government-backed security that most fixed-rate mortgages in America use.
Lenders add their margin on top of the base rate. This margin is between 1.5% and 3%. It covers costs, risk, and profit. When I helped the Johnsons buy their first home in Greenville, we found a 0.75% difference in margins between lenders. This meant $112 in monthly savings.
Boosting your down payment to 10-20 percent can trim hundreds off monthly payments and eliminate private mortgage insurance, directly improving affordability.Ref.: “Fannie Mae. (2024). What You Need To Know About Down Payments. Fannie Mae.” [!]
Lender margins change based on:
- Your credit score (720+ gets the best rates)
- Down payment amount (20%+ saves on PMI and rates)
- Loan-to-value ratio (lower means lower risk)
- Property type (single-family homes get better rates)
First-time buyers often focus only on the final rate. They don’t see how debt versus down payment affects their qualification. These factors greatly influence how mortgage rates affect housing affordability for you.
Fixed Versus Variable Product Differences
The mortgage industry has three main parts: originators, aggregators, and investors. This setup affects the two main rate products: fixed and variable rates.
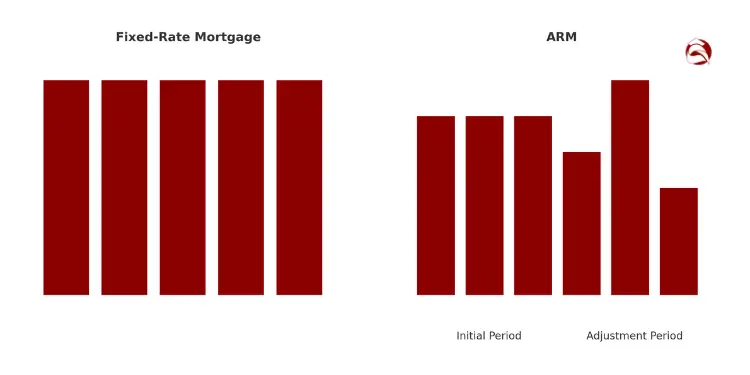
Fixed-rate mortgages have the same rate for the whole loan term. When rates go up, fixed rates keep your budget steady. A 30-year fixed loan at 6.5% today will always be 6.5% in year 29, no matter the market.
| Feature | Fixed-Rate Mortgage | Adjustable-Rate Mortgage (ARM) |
|---|---|---|
| Rate stability | Complete – never changes | Initial period only (3-10 years) |
| Initial rate | Typically higher | Usually 0.5-1% lower |
| Risk level | Low – predictable payments | Higher – possible payment jumps |
| Best for | Long-term homeowners | Short-term owners (3-7 years) |
Adjustable-rate mortgages (ARMs) work differently. Their rates can change monthly, every six months, annually, or less. A 5/1 ARM has a fixed rate for five years, then adjusts annually. ARMs often start with lower rates than fixed mortgages.
CFPB warns that adjustable-rate mortgages can jump sharply after the introductory period, adding significant payment shock if rates rise.Ref.: “Consumer Financial Protection Bureau. (2020). Consumer Handbook on Adjustable-Rate Mortgages. CFPB.” [!]
ARMs can increase your buying power at first. But, you face uncertainty when the rate changes. Last year, I helped a family save $175 monthly by choosing an ARM. They planned to refinance before the rate changed.
“The difference between fixed and variable rates isn’t just about numbers—it’s about matching your mortgage to your life plan. If you’ll move in five years, paying extra for 30 years of stability doesn’t make financial sense.”
Understanding mortgage interest rates helps you make smart choices. You won’t just accept any rate offered. Next, we’ll look at how these rates affect your monthly payment and affordability.
“Explore More: Frugal home buying tips for budget conscious buyers“
Linking rates to monthly payments
Mortgage interest rates and monthly payments are closely linked. When rates change, your buying power does too. A 1% rate change can increase your monthly payment by 10-12%.
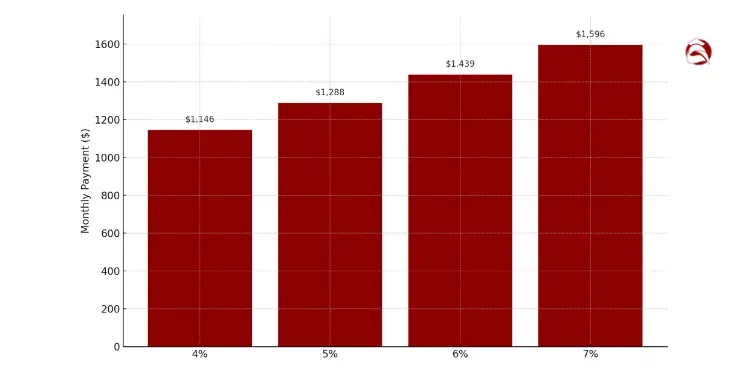
For example, a $300,000 home with 20% down ($60,000) means financing $240,000. At 5% interest, your monthly payment is $1,288. But at 6%, it jumps to $1,439, adding $151 to your monthly costs.
Redfin says the median monthly mortgage payment in January 2025 was $2,793. This is close to the highest ever. High home prices and interest rates make mortgage affordability tough for many.
Sample Amortization Tables Comparison Examples
Let’s look at how different rates change your payments. We’ll use a $240,000 loan for examples:
| Interest Rate | Monthly Payment (P&I) | Total Interest Paid (30 years) | Monthly Payment Increase | Buying Power Reduction |
|---|---|---|---|---|
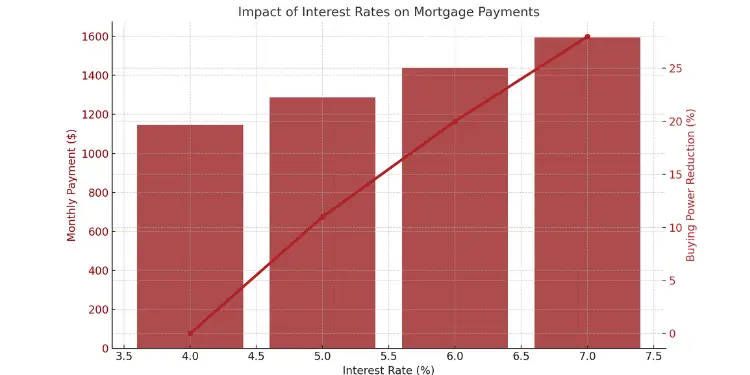
| 4% | $1,146 | $172,560 | Baseline | Baseline |
| 5% | $1,288 | $223,680 | +$142 (12.4%) | -11% |
| 6% | $1,439 | $278,040 | +$293 (25.6%) | -20% |
| 7% | $1,596 | $334,560 | +$450 (39.3%) | -28% |
The “buying power reduction” column shows a big drop at 7% interest. You can afford 28% less house than at 4% with the same payment. This makes buying a home hard for many.
Redfin data show the median monthly mortgage payment hit a record $2,807 in March 2025, underscoring how elevated rates have pushed costs to all-time highs.Ref.: “Anderson, D. (2025). Housing Market Update: Homebuyers’ Monthly Housing Payment Hits Record High. Redfin News.” [!]
Let’s see how the first five years of payments change between 4% and 7% interest:
| Year | 4% – Principal Paid | 4% – Interest Paid | 7% – Principal Paid | 7% – Interest Paid |
|---|---|---|---|---|
| Year 1 | $4,310 | $9,442 | $2,208 | $16,944 |
| Year 3 | $13,560 | $27,684 | $7,104 | $49,248 |
| Year 5 | $23,616 | $45,144 | $12,672 | $80,088 |
Notice how the interest-to-principal ratio changes a lot. At 7%, you pay nearly $35,000 more in interest in five years. You also build equity slower.
The NAHB says 100.5 million households can’t afford the median-priced new home ($459,826) at 6.5% rates. This shows how hard it is to afford homes across America.
Remember, a bigger down payment can help with higher rates. A 25% down payment on a $300,000 home saves about $90 monthly at 6% interest. Think about whether a large or small down payment is better for you.
I always tell my first-time buyers to run their numbers at various interest rate scenarios before falling in love with a property. Understanding exactly how rates affect your monthly commitment prevents heartbreak and financial strain down the road.
Don’t forget, your total monthly housing cost is more than just principal and interest. Property taxes, insurance, and possibly mortgage insurance or HOA fees add up. These costs can be 25-50% more than your mortgage payment, depending on where you live.
“Discover More: How to reduce debt before buying house effectively“
Charting historical rate movement trends
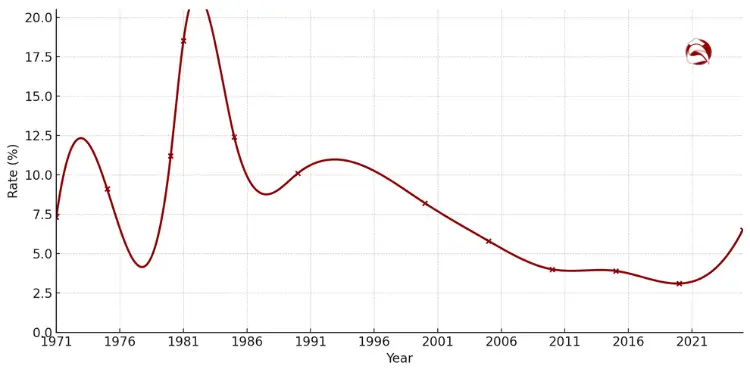
Looking at mortgage rates over time shows patterns. These patterns help smart buyers know when to buy. Today’s rates might seem high, but they’re not new.
Most buyers today are used to low rates from the 2010s. Rates were around 4% from 2010 to 2021. This made many think rates would always be low.
By early 2022, rates started going up fast. The Federal Reserve was fighting inflation. Rates hit 7.08% by late 2022, the highest in over 20 years.
| Time Period | Average 30-Year Fixed Rate | Market Conditions | Buyer Impact |
|---|---|---|---|
| 1971-2000 | 8.9% | High inflation era | Lower purchase prices, higher payments |
| 2000-2009 | 6.3% | Housing boom and crash | Volatile conditions, changing qualification standards |
| 2010-2021 | 4.0% | Post-recession recovery | Increased buying power, rising home prices |
| 2022-Present | 6.5-7.1% | Inflation correction | Reduced affordability, slowing price growth |
Recently, mortgage rates have gone down a bit. But they’re not as low as in 2021. This makes it harder for first-time buyers to afford homes.
“Mortgage rates don’t exist in isolation—they typically track with the 10-year Treasury bond yield, plus a premium. When you see Treasury yields moving, mortgage rates eventually follow, though not always in perfect lockstep.”
Watching mortgage rates and Treasury yields is helpful. Lower rates in 2025 might follow the 10-year Treasury bond yield. Buyers watch both to plan their moves.
I’ve helped many clients with rate changes in Greenville for nine years. The best buyers know rates go up and down. Today’s rates might seem high, but they’re near the average. This helps buyers make smart choices.
Forecasting rates using economic indicators
Learning about economic indicators helps homebuyers make smart choices. No exact mortgage rate predictions exist. But, certain economic signs can show which way rates might go. This info is key when deciding to lock in a rate or wait for better terms.
The housing market reacts differently to these indicators. When many signs point in the same direction, rate changes are more likely. Let’s look at the best tools for predicting rates that homebuyers can use.
“Related Articles: Joint home buying budget tips for couples“
Monitoring Central Bank Announcements Closely
The Federal Reserve greatly affects interest rates in America. When the Fed changes its federal funds rate, mortgage rates often follow soon after.
I tell my clients to watch for the Federal Open Market Committee (FOMC) meetings. These happen eight times a year. The Fed’s statements after these meetings can hint at future rate changes.
Right now, the Fed expects 2-3 rate cuts in the next year. This could lower mortgage rates by 0.5-0.75%. This could help those waiting to buy a home.
“The bond market’s perception of how well the Fed is controlling inflation through the administration of short-term interest rates determines longer-term interest rates, such as the yield on the U.S. Treasury 10-year bond.”
You can follow these announcements on the Federal Reserve’s website or through financial news. Marking these dates on your calendar could save you thousands on your loan.
“You Might Also Like: How to buy house on low income successfully“
Tracking Inflation and Unemployment Correlations
Inflation and unemployment rates are key. They influence the reserve’s interest rates. When inflation goes up, the Fed might raise rates to slow the economy. This can make houses less affordable.
But, when unemployment is high, the Fed might lower rates to help the economy grow. This balance helps predict rate changes:
- Rising inflation + Low unemployment = Likely rate increases
- Low inflation + Rising unemployment = Possible rate cuts
- Stagflation (high inflation + high unemployment) = Unpredictable rate environment
The Consumer Price Index (CPI) and Personal Consumption Expenditures (PCE) reports show inflation well. The Bureau of Labor Statistics releases employment figures monthly. These indicators help forecast rate changes.
“Further Reading: How to avoid overspending on house purchase budget“
Watching Bond Yields for Direction
Bond yields, like the 10-year Treasury yield, closely relate to mortgage rates. Mortgage-backed securities compete with Treasury bonds for investor money. When bond yields go up, mortgage rates often follow soon.
You don’t need a finance degree to keep an eye on this. Websites show the 10-year Treasury yield clearly. Big changes (over 0.25%) often mean mortgage rates will change too.
The spread between the 10-year Treasury yield and 30-year fixed mortgage rates usually is 1.5% to 2.5%. If this spread gets too wide, mortgage rates might adjust to balance it out.
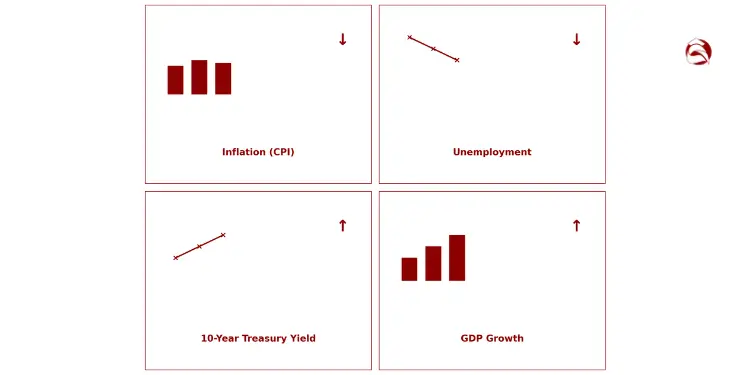
| Economic Indicator | Effect on Rates When Rising | Effect on Rates When Falling | Typical Response Time |
|---|---|---|---|
| Federal Funds Rate | Mortgage rates increase | Mortgage rates decrease | 1-14 days |
| Inflation (CPI) | Upward pressure | Downward pressure | 2-4 weeks |
| Unemployment Rate | Downward pressure | Upward pressure | 2-8 weeks |
| 10-Year Treasury Yield | Direct increase | Direct decrease | 1-7 days |
| GDP Growth | Gradual increase | Gradual decrease | 1-3 months |
Knowing these connections helps you understand how rates impact house prices and affordability. For example, when the Fed raises rates to fight inflation, borrowing costs go up. This can slow home price growth as fewer buyers qualify for loans at higher rates.
No single indicator gives perfect predictions. But, by watching these key signs, you can get a good idea of rate changes before they affect your homebuying journey.
“Related Topics: Clear signs you are not ready to buy house yet“
Assessing rate impact on qualification
Interest rates change how much house you can buy. When rates go up, you can buy less. This surprises first-time buyers who thought they could afford more.
Over 100.5 million American households can’t afford the median-priced new home now. A small rate increase would make 1.14 million more households unable to buy. These numbers show how rising interest rates affect homes for everyone.
“Read More: How interest rates affect affordability for home buyers“
Debt to Income Adjustments Under Stress
Lenders look at your debt-to-income ratio to decide if you can get a mortgage. This ratio is your monthly debt compared to your income. Most lenders say you can’t spend more than 43% of your income on debt.
Let’s say you make $6,000 a month. You can’t spend more than $2,580 on debt. With a 4.5% interest rate, you might qualify for a $400,000 home. But with a 6.5% rate, you can only afford a $320,000 home. That’s a $80,000 difference from just a 2% rate increase.
This makes it hard for buyers. They might:
- Lower their target purchase price
- Increase their down payment to reduce loan amounts
- Find ways to reduce other monthly debts
- Postpone buying until rates improve or incomes increase
First-time buyers have it tough. They often have student loans and car payments. When rates go up, they might need to pay down other debts to qualify.
Many lenders offer “stress test” calculators. These show how different rates affect your buying power. It’s smart to use these before you start looking for homes.
Being able to afford a home isn’t just about the price. It’s about the monthly payment. When rates rise, being ready for different scenarios helps you adjust your plans.
“For More Information:
Timing purchase strategies amid volatility
Many people wonder, “Should I buy now or wait for rates to drop?” With mortgage rates at 6.76%, making a choice is hard. Let’s look at some practical steps.
First, understand the rate-price seesaw. When rates go up, prices might stay the same. This is because fewer people want to buy. But when rates fall, more people want to buy. This can make housing less affordable because prices go up.
Let’s compare the costs. At 4%, a $300,000 loan costs $1,432 a month and $215,609 in interest. At 6%, it’s $1,799 a month and $363,095 in interest. This means you could pay $367 more each month.
Don’t forget about closing costs. They vary by region. The West Coast is 2-3%, the Midwest is 1.5-2.5%, the South is 2-2.5%, and the Northeast is 2-4%. These costs affect how much cash you need upfront.
CFPB recommends securing a mortgage pre-approval early; it identifies documentation gaps and signals serious intent to sellers—often strengthening your negotiating position.Ref.: “Consumer Financial Protection Bureau. (2024). Get a Preapproval Letter. CFPB.” [!]
Your best strategy? Follow these steps:
1. Get pre-approved to know your exact budget
2. Do a budget check including taxes, insurance, and maintenance
3. Set price alerts for homes 10% below your max
4. Watch for rate dips but focus on long-term housing needs
Remember, your home is both a place to live and a possible investment. The right time to buy depends on the market and your personal plans. With careful planning, you can find a good time to buy.


