
Knowing the house price to income ratio helps avoid money troubles when buying your first home. This key number is like a safety net. It keeps your dreams of owning a home from turning into financial nightmares.
But how much home can you really afford? Almost 32% of first-time buyers in America buy homes that are too expensive. This leads to money worries within two years.
My mentor once said, “The difference between homeowner happiness and hardship often comes down to respecting financial ratios.” I’ve seen it myself. Clients who ignored these rules had trouble with their payments. But those who checked their income and expenses stayed financially stable.
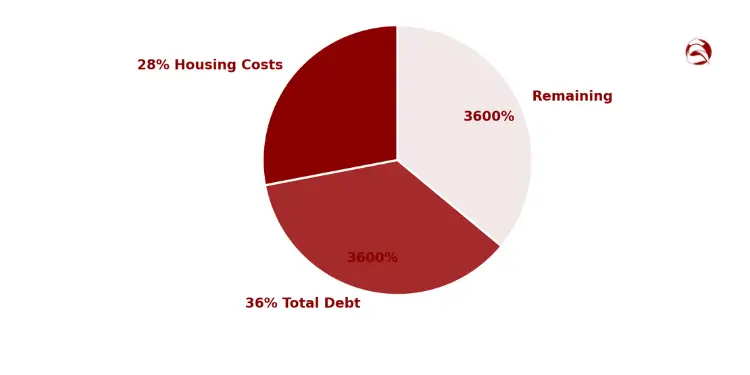
Lenders use the 28/36 rule to check if you can afford a mortgage. This means your home costs can’t be more than 28% of your monthly income. And all your debts should be under 36%. This rule helps you stay financially healthy as a homeowner.
Keeping housing costs ≤ 28 % and total debt ≤ 36 % aligns with the CFPB’s Qualified-Mortgage “ability-to-repay” safe-harbor, helping borrowers secure smoother approvals and shielding them from costly last-minute re-underwriting. Ref.: “Consumer Financial Protection Bureau. (2013). Ability-to-Repay Rule Factsheet. CFPB.” [!]
Quick hits:
- Calculate your personal affordability threshold
- Understand lender evaluation metrics
- Avoid becoming “house poor”
- Maintain financial flexibility after purchase
- Find balance between dreams and reality
Understanding benchmark affordability ratios today
Today’s benchmark affordability ratios have changed a lot. They are now key financial tools. When I talk to first-time buyers in Greenville, I explain the price to income ratio is key.
The price to income ratio is simple. You divide the median house price by the median income. For example, if the median home price is $300,000 and the median income is $75,000, the ratio is 4.0. This means the home costs four times the income.
The housing industry uses several ratios to help buyers. The 28% rule is common. It says you should spend no more than 28% of your income on your home.
Let’s use real numbers. If you make $6,000 a month, you can spend up to $1,680 on your home. This helps buyers know how much they can afford.
The 28/36 rule adds more protection. It says your housing costs should be under 28% of your income. But your total debt payments should not be over 36% of your income. For our example, total debt payments should not exceed $2,160.
Global Ratio Standards and History
Using income multiples to check if homes are affordable is not new. In the 1970s and early 1980s, homes cost 2 to 3 times the average income. I tell my clients how different today’s market is.
Today, the average home price to income ratio is around 4.5 in many U.S. markets. But, coastal cities like San Francisco and New York have ratios over 8.0. Midwestern markets might have ratios closer to 3.0.
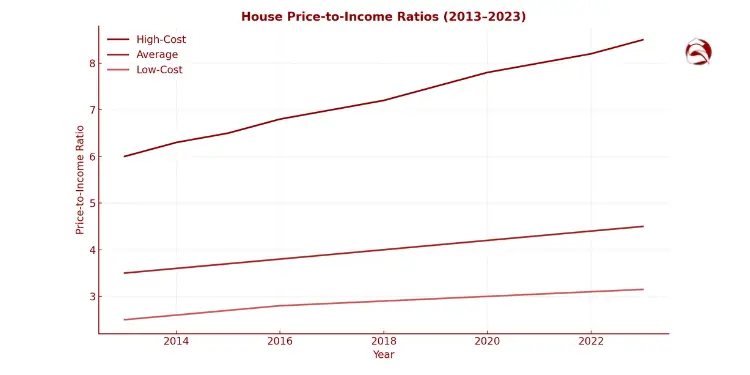
Harvard’s 2025 report shows the median existing-home price now equals about 5× median household income—well above the classic 3× benchmark—underscoring why strict affordability ratios matter for first-time buyers. Ref.: “Joint Center for Housing Studies. (2025). The State of the Nation’s Housing 2025. Harvard University.” [!]
International markets show big differences too. Canada, Australia, and the U.K. often have higher ratios than the U.S. Germany has lower ratios because of its housing policies.
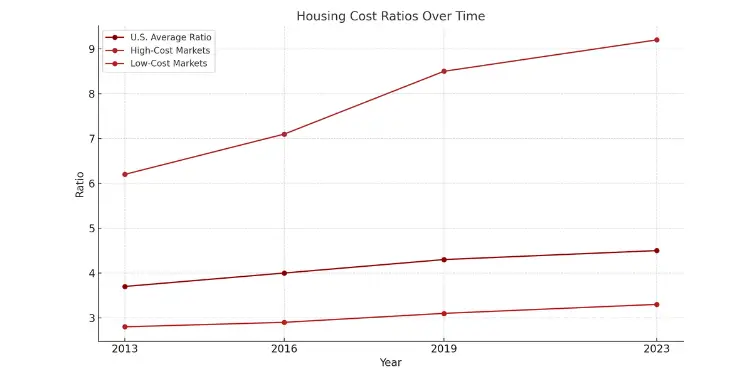
| Year | U.S. Average Ratio | High-Cost Markets | Low-Cost Markets | Interest Rate Impact |
|---|---|---|---|---|
| 2013 | 3.7 | 6.2 | 2.8 | Moderate |
| 2016 | 4.0 | 7.1 | 2.9 | Low |
| 2019 | 4.3 | 8.5 | 3.1 | Low |
| 2023 | 4.5 | 9.2 | 3.3 | High |
Today’s high prices and interest rates mean we need to look at more than just ratios. The 28% rule was made for lower prices and different loans. Buyers now face higher student debt, property taxes, and insurance costs.
But, these ratios are important. I’ve helped many first-time buyers understand if a home fits their budget. These ratios are just a starting point.
When a client wants a home above these ratios, we look at their whole financial situation. Sometimes, low expenses or a stable job can justify it. Other times, high student loans or variable income mean we should be more careful.
These ratios are the base for more detailed calculations we’ll cover later. Knowing the history and current use of these ratios helps buyers plan better.
Fannie Mae caps total DTI at 36 % for manual underwriting and allows up to 50 % via Desktop Underwriter®; crossing these thresholds typically triggers denials or higher pricing. Ref.: “Fannie Mae. (2025). B3-6-02, Debt-to-Income Ratios. Selling Guide.” [!]
“Related Articles: How to avoid overspending on house purchase budget“
Gathering accurate household income data
Figuring out how much you can afford to spend on a home starts with knowing your income. Many first-time buyers make mistakes with their income numbers. This can lead to trouble when they try to get a mortgage.
Lenders want to see proof of your income, not just what you think you make. They look at your gross income, which is your total earnings before taxes and deductions.
Here’s how to get your income data right:
- Primary employment (W-2 wages or salary)
- Secondary employment or side gigs
- Self-employment earnings (Schedule C income)
- Investment income (dividends, interest, capital gains)
- Rental property income
- Alimony or child support (if you choose to disclose)
- Retirement distributions or pension payments
For couples, both should gather their income data separately. Then, add it together for a total household income. Your area’s median income is helpful, but your personal income is what lenders care about most.
“The difference between perceived income and documented income is often the difference between pre-approval and rejection. Don’t guess—know your numbers cold before approaching lenders.”
Including Bonuses and Commissions Predictably
Income that changes, like bonuses or overtime, needs careful handling. Buyers often make mistakes by assuming these incomes will always be high.
Here’s a safe way to include variable income in your budget:
- Gather proof of variable income for the last 24 months
- Find the average monthly income over this time
- Reduce this average by 25% as a safety measure
- Only count this income if it’s stable or growing
For example, if you made $12,000 in commissions in 2021 and $18,000 in 2022, your average monthly income is $1,250. After a 25% reduction, you can only count on $937.50 monthly in your budget.
This method helps avoid overextending your budget based on high income hopes. Income that changes a lot can make it hard to pay your mortgage if you’re not careful.
For those with income that changes a lot, like seasonal workers, make a chart of your income for at least two years. This helps show patterns and a reliable income level.
“Explore More: How to reduce debt before buying house effectively“
Verifying Documentation for Mortgage Lenders
Lenders need specific documents to check your income. Being ready with these documents can speed up the mortgage process and might even get you better loan terms.
Here’s what you’ll need:
| Income Type | Required Documentation | Lookback Period | Special Notes |
|---|---|---|---|
| W-2 Employment | W-2 forms, pay stubs | 2 years | Recent 30 days of pay stubs needed |
| Self-Employment | Tax returns, profit/loss statements | 2-3 years | Business stability is key factor |
| Commission/Bonus | Employer verification letter, history | 24 months | Must show consistency or growth |
| Investment Income | Account statements, tax schedules | 2 years | Must have 3+ years continuation |
| Alimony/Support | Court decree, payment history | 6-12 months | Must continue 3+ years to count |
Lenders look at how stable and growing your income is. A steady income with some growth is better than income that changes a lot, even if it’s higher sometimes.
For income that’s not usual, like YouTube money, be ready for extra checks. I helped a client with YouTube income by showing payment records, subscriber growth, and partnership deals to prove it’s steady.
If you’ve changed jobs, lenders want to see you’ve stayed in the same field. Job-hopping in the same field is better than switching careers.
Your debt vs. down payment plans also affect how lenders see your income. More stable income can help with higher debt in the mortgage process.
Income growth is almost as important as your current income. Lenders like it when your income grows by 3-5% each year, even if it’s the same at application time.
By carefully documenting all your income and knowing how lenders will look at it, you’ll be ready to use house price to income ratios in your home search. This preparation turns general affordability rules into specific, useful guidelines for you.
“For More Information: Cost breakdown buying house for first time buyers“
Analyzing local market price trends
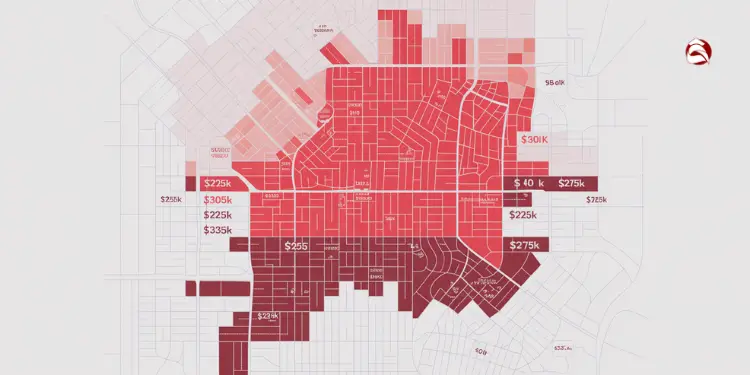
Smart buyers look at local market trends, not just national numbers. The national median home price doesn’t match what you’ll find in your area. Many first-time buyers get discouraged by comparing their budget to national stats that don’t apply to their area.
National median house prices hide big differences in different areas. For example, downtown areas might have homes $100,000 more than suburbs just a few miles away. This big difference affects how much you can afford.
Finding Reliable Local Price Data
To get accurate local market info, start with these sources:
- HUD’s Fair Market Rent data for your county
- Your local Multiple Listing Service (MLS) reports (accessible through a realtor)
- County assessor’s office for recent sale records
- Local real estate brokerage market reports
Don’t use national real estate websites for prices. Their data mixes different areas, making averages misleading. Instead, watch median house prices in your area for at least six months to see trends.
The 28/36 rule doesn’t fit everyone. Many homebuyers today have to spend more than 28 percent of their income on housing.
This old rule is hard to follow today. Places like Florida have higher insurance costs. Wages and inflation have also changed, making it hard to follow this rule. Knowing your local market is key.
Case Study: Same City, Different Affordability
Last year, I helped two buyers with the same income of $75,000 in the same city. The first buyer looked at Oakwood, where homes cost $295,000. This made their price-to-income ratio 3.9, which is affordable.
The second buyer wanted Riverside, where homes cost $375,000. This made their ratio 5.0, making it harder to afford. By choosing a different neighborhood, the first buyer found better deals.
“Learn More About: How to budget for closing costs in advance“
Tracking Price Trends Over Time
Make a spreadsheet to track key metrics monthly in your target areas:
- Median house price
- Average price per square foot
- Average days on market
- Number of new listings
- Price reductions percentage
This tracking shows seasonal patterns and market changes. For example, rising prices and fewer days on market mean it’s getting more competitive. But, if prices drop, you might have a chance to negotiate.
Watch how prices compare to local incomes. If prices rise faster than wages, it gets harder to afford homes. This might lead to market changes.
| Neighborhood | Median Price | Price/Sq.Ft | Days on Market | Price-to-Income Ratio* |
|---|---|---|---|---|
| Downtown | $325,000 | $215 | 18 | 5.4 |
| Westside | $275,000 | $165 | 24 | 4.6 |
| Northpark | $230,000 | $145 | 32 | 3.8 |
| Southridge | $198,000 | $125 | 45 | 3.3 |
| *Based on median household income of $60,000 | ||||
Interpreting Price-Per-Square-Foot
Just looking at the average house price isn’t enough. Price-per-square-foot helps compare values. First-time buyers often miss this, focusing on the total price.
For example, a $250,000 home at $125/sq.ft offers more space than a $250,000 home at $175/sq.ft. This metric helps find neighborhoods where your budget goes further, improving your affordability.
Census 2023 figures peg the national median new-home cost at $154.70 per sq.ft.; benchmarking listings against this and local medians helps buyers spot overpriced properties fast. Ref.: “Thompson, P. & Grundy, A. (2024). Where You Can Get More House for the Money. U.S. Census Bureau.” [!]
“Check This Out: House price to income ratio rule for buyers“
Creating Your Neighborhood Comparison Tool
I suggest making a spreadsheet to compare house prices by income ratio in different neighborhoods. This tool helps see where your budget fits best.
Include columns for neighborhood name, median sale price, your income, and the price-to-income ratio. Sort by this ratio to find the most affordable areas. This makes complex market data easy to understand for your situation.
Remember, national affordability rules don’t always apply to you. Focus on local data to understand what’s affordable for you.
Adjusting ratio for debt obligations
The standard house price to income ratio needs adjustment for debt like student loans and car payments. This ratio is a starting point, but lenders look at more. They check your debt to income ratio for mortgage approval.
Your debt to income (DTI) ratio compares monthly debt to income. It shows your financial health better than the basic ratio. Lenders want a DTI below 43%, but some loans allow higher ratios.
To calculate your DTI ratio:
- Add up all monthly debt payments (credit cards, car loans, student loans, etc.)
- Divide this total by your gross monthly income
- Multiply by 100 to get your percentage
For example, if your monthly debt payments total $1,500 and your gross monthly income is $5,000, your DTI ratio would be 30% ($1,500 ÷ $5,000 × 100 = 30%).
Lenders calculate two DTI ratios for mortgages. The front-end ratio looks at housing costs. The back-end ratio includes all debt. They focus more on the back-end ratio.
To find out how much house you can afford, adjust your basic ratio. Start with a target ratio (2.5-3.5), then lower it based on your debt.
Impact of Student and Car Loans
Student loans and car payments are common debts for first-time homebuyers. They reduce how much you can spend on a house.
Student loans can be tough. Even with income-based plans, lenders use 0.5-1% of the loan balance for DTI. A $50,000 student loan could cut your home buying power by about $75,000.
Car loans have higher monthly payments but shorter terms. A $500 monthly car payment could reduce your mortgage by about $100,000, based on interest rates and other factors.
Federal Reserve research links larger student-loan balances to delayed homeownership and tighter credit: higher education debt lowers approval odds even when income is steady, so factor these payments into your ratio calculations. Ref.: “Mezza, A., Ringo, D., & Sommer, K. (2021). Student Loans, Access to Credit and Consumer Financial Behavior. Federal Reserve Board.” [!]
To see how debt affects your home buying power, look at this table:
| Monthly Debt Payment | Annual Income | DTI Without Mortgage | Maximum Mortgage Payment | Approximate Home Price Reduction |
|---|---|---|---|---|
| $250 | $60,000 | 5% | $1,550 | $45,000 |
| $500 | $60,000 | 10% | $1,300 | $90,000 |
| $750 | $60,000 | 15% | $1,050 | $135,000 |
| $1,000 | $60,000 | 20% | $800 | $180,000 |
This table assumes a 43% DTI ratio, a 30-year mortgage at 4.5% interest, and includes property taxes and insurance. The home price reduction shows how much less house you can afford with debt.
Another important metric is the price-to-rent ratio. It compares home prices to annual rental costs. Divide the median home price by the annual rent for a similar property.
A high price-to-rent ratio (above 20) might mean renting is better in the short term. A low ratio (below 15) suggests good buying conditions. This ratio helps decide if buying is better than renting while you work on your debt.
To improve your ratios and buying power, try these strategies:
- Pay down high-interest debt before applying for mortgages
- Avoid taking on new debt in the months before applying
- Consider refinancing existing loans to lower monthly payments
- Look into income-driven repayment plans for student loans
- Increase your down payment to reduce the loan amount needed
By including your debt in your house price to income calculations, you get a more accurate affordability assessment. This approach helps avoid financial strain from buying more house than you can afford with your debt.
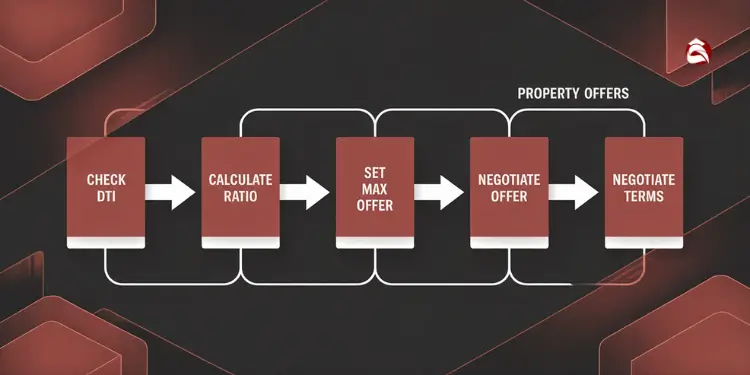
Applying ratio in purchase negotiations
Your house price to income ratio is a key tool in negotiations. I’ve helped many first-time buyers. They avoid regret by sticking to their ratio limits.
Check your debt-to-income ratio (DTI) before making an offer. Divide your monthly debt by your income and multiply by 100. Keep your DTI under 36% for a healthy mortgage.
For more info, visit this link.
Using Ratio When Bidding Competitively
In competitive markets, sticking to your ratios is tough but vital. Remember, price ratios show your financial reality.
Instead of overpaying, use other offers to stand out. Offer flexible dates, fewer contingencies, or a personal letter. I’ve seen buyers win with these strategies, even with lower offers.
Make a budget check sheet for your maximum offer. Carry it to viewings as your financial guide. It helps you stay calm and make smart choices.
If you love a home that’s too pricey, take advice from McBride. Pay down debt or increase your income first. This way, you avoid a bad mortgage later.


