
Finding the right tools for your home buying budget makes big decisions easier. Knowing how much house you can afford is key in today’s market. Skipping financial prep can lead to big problems.
Did you know 40% of buyers spend more than they planned? This can cause stress and regret. One of my clients said, “I wish I had seen these worksheets before looking at houses.”
I’ve helped many Greenville families with mortgages. I’ve seen how good prep stops common buyer regrets. The right tools and worksheets can make all the difference before you make an offer.
When first-timers see the financial papers, they often ask, “Do we really need all these?” Yes, you do—very much. This is true when figuring out your homebuying budget in a market where housing costs are very high.
Quick hits:
- Accurate calculators prevent costly approval rejections
- Proper worksheets reveal hidden ownership expenses
- Financial preparation builds lender confidence
- Budget clarity empowers stronger negotiations
- Fifteen minutes of planning saves thousands
A 2024 national survey found that 40 % of recent buyers exceeded their original purchase budget, reinforcing the importance of rigorous pre-offer cost planning. Ref.: “Clever Real Estate Research Team. (2024). American Home Buyer Report: 2024 Edition. Clever Real Estate.” [!]
Comprehensive Calculators Estimating True Ownership Costs
True homeownership costs are more than just the mortgage payment. When I talk to clients, they often learn about all the extra costs. Basic mortgage calculators only show the principal and interest, missing important costs.
The Federal Housing Administration (FHA) says 21% of first-time buyers don’t know their total monthly costs. This mistake can make buying a home stressful and expensive soon after.
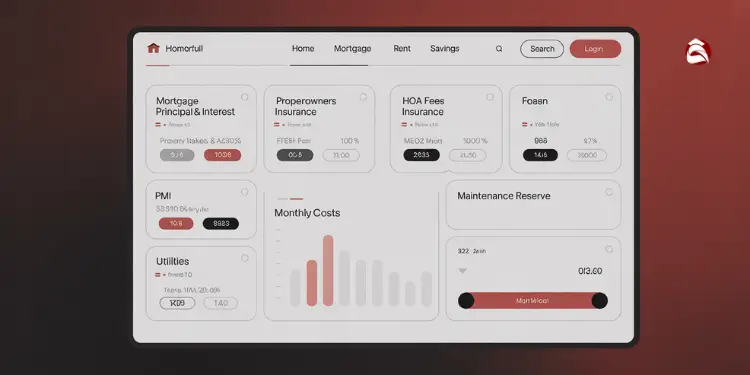
A good home affordability calculator includes all the costs ignored by basic tools. This includes property taxes, insurance, PMI, HOA fees, maintenance, and utilities. These costs can add 40-50% to your mortgage payment.
“The difference between a successful homebuying experience and a stressful one often comes down to understanding the true cost of ownership before making an offer.”
Last month, I helped a couple think they could afford a $350,000 home. But a detailed calculator showed they could only afford $300,000. This is because of the hidden costs of buying a house.
Hidden ownership expenses—property taxes, insurance, and utilities—add an average of nearly $15,000 per year to a homeowner’s outlay, costs that basic calculators usually overlook. Ref.: “Zillow Research & Thumbtack. (2023). Hidden Costs of Homeownership. Zillow Research.” [!]
I recommend the Consumer Financial Protection Bureau’s “Explore Interest Rates” calculator. It helps you figure out how much house you can afford. You’ll need:
- Your actual credit score (not an estimate)
- Down payment amount
- Preferred loan term
- Property location (for accurate tax estimates)
- Monthly debt obligations
Adjustable Scenario Inputs For Changing Variables
Comprehensive calculators are powerful because they let you change many things at once. This shows how each change affects your money.
For example, I showed a client how paying off a $2,000 credit card could save her $87 a month on her mortgage. This small step saved her $31,320 over 30 years.
The best calculators let you try different scenarios by changing things like:
| Variable | Potential Impact | Typical Adjustment Range | Financial Effect |
|---|---|---|---|
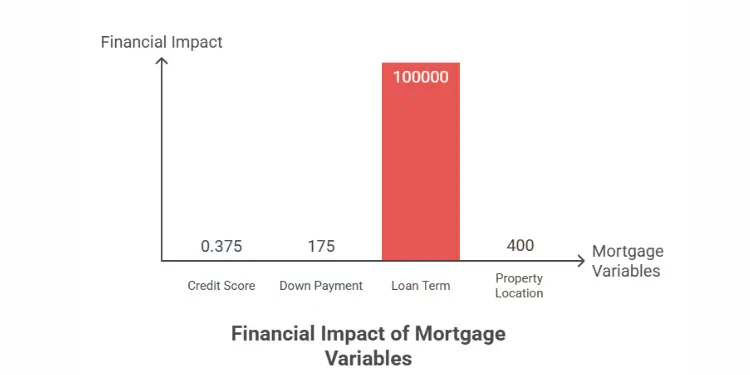
| Credit Score | Mortgage rate reduction | 20-50 points | 0.25-0.5% rate decrease |
| Down Payment | PMI elimination | 5-20% | $100-250 monthly savings |
| Loan Term | Total interest paid | 15-30 years | $50,000-150,000 lifetime difference |
| Property Location | Tax and insurance costs | Varies by county | $200-600 monthly variance |
I always tell clients to try at least three scenarios: best, worst, and most likely. This helps avoid surprises and financial trouble.
The CFPB’s “Explore Interest Rates” dashboard lets buyers model credit-score, down-payment, and loan-type scenarios side-by-side, revealing rate spreads of up to 0.80 percentage points for identical profiles. Ref.: “Consumer Financial Protection Bureau. (2025). Explore Interest Rates Tool. CFPB.” [!]
The mortgage rate you get affects how much you can buy. A small change in rate can mean a big difference in price. So, it’s important to test different rates before looking for a house.
Don’t forget about closing costs. They can be 2-5% of the loan amount and affect how much cash you need. Good calculators include these costs.
Using detailed calculators helps you understand not just today’s affordability but also how your finances might change. This knowledge helps avoid the payment shock that can happen after buying a home.
To prepare for closing costs, How to budget for closing costs in advance outlines effective strategies.
Interactive Spreadsheets For Tracking Monthly Allocations
My clients get clear on their finances with custom spreadsheets. These tools track money as they buy a home. Old budget sheets just don’t cut it anymore.
The 50/30/20 budget plan is a good start. It splits your income into needs, wants, and savings. But buying a home needs more detailed tracking.
I give my clients three spreadsheets for different times in their homebuying journey. Each one has a special job:
| Timeframe | Spreadsheet Focus | Key Benefits | Common Discoveries |
|---|---|---|---|
| Pre-Purchase | Down Payment Acceleration | Identifies “hidden money” in current budget | Average client finds $250-450 extra monthly |
| Purchase Transaction | One-Time Cost Organization | Tracks timing of all required payments | Prevents surprise cash flow shortages |
| Post-Purchase | New Homeowner Expenses | Adjusts budget for ownership costs | Reduces first-year financial stress |
The pre-purchase spreadsheet finds ways to grow your down payment. A couple in Greenville found $430 extra each month for their home.
Seeing where your money goes often reveals hidden expenses. Buyers often find 10-15% of their budget goes to untracked spending.
“I had no idea we were spending $267 a month on coffee and lunch runs. Seeing that number in our spreadsheet was the wake-up call we needed to get serious about our down payment savings.”
The purchase transaction spreadsheet organizes one-time costs. You’ll know when to pay for things like earnest money and closing costs. This avoids cash flow surprises.
Knowing your mortgage payment is just the start. The spreadsheet helps plan for all expenses during the purchase. This ensures you’re ready to pay when it’s time.
The post-purchase spreadsheet is very useful. It helps you adjust to being a homeowner. It tracks new expenses like water bills and lawn care.
- Water and sewer bills (often paid quarterly)
- Trash and recycling services
- Lawn maintenance or HOA fees
- Higher utility costs for larger spaces
- Home maintenance reserves (experts recommend 1% of home value annually)
These spreadsheets are interactive and secure. They connect to your bank accounts for real-time budget updates.
They adjust your budget as you enter new info. Changes in mortgage rates or taxes are shown right away. This helps you make smart choices.
These tools grow with you, unlike old worksheets. They turn complex planning into a simple dashboard. This keeps you on track to being a successful homeowner.
For couples planning to buy a home together, Joint home buying budget tips for couples offers tailored advice.
Mortgage Rate Comparison Dashboards With Alerts
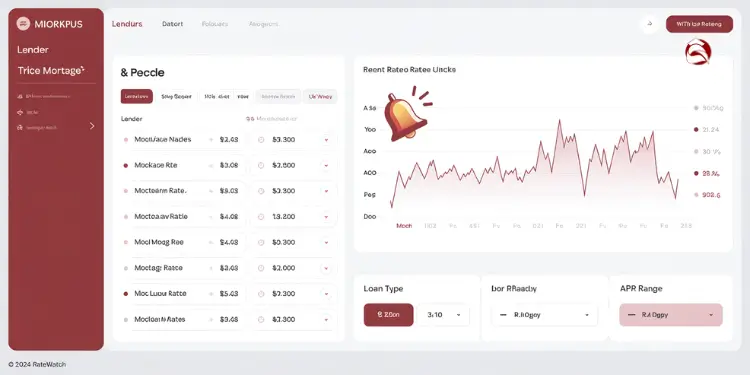
Many homebuyers only apply with one lender. But, modern dashboards help you compare rates from many lenders. This can save you thousands of dollars.
These dashboards watch different loan types like conventional and FHA loans. They show rates from dozens of lenders live. This way, you see all your options, not just a few.
A 0.5% difference in your mortgage interest rate on a $300,000 loan translates to approximately $30,000 in savings over a 30-year term. Rate shopping isn’t just smart—it’s essential.
Freddie Mac research shows that obtaining just four competitive quotes lowers the average borrower’s rate by 28 basis points—saving $600–$1,200 per year on a $300 k loan. Ref.: “Beeston, J. (2025). A Simple Shopping Tip Can Save You Hundreds on Your Mortgage. Investopedia.” [!]
Alerts make these dashboards even better. Set up notifications for when rates drop. My client saved $62 a month by locking in a rate at midnight.
Look for dashboards that show the Annual Percentage Rate (APR). This includes points and fees that lenders might hide. Knowing the APR helps you understand the true cost of your loan.
| Loan Type | Typical Down Payment | Credit Score Requirements | Special Features |
|---|---|---|---|
| Conventional Loan | 3-20% | 620+ | Lower PMI with 20% down |
| FHA Loan | 3.5% | 580+ (3.5% down), 500-579 (10% down) | More flexible credit requirements |
| VA Loan | 0% (No down payment required) | No minimum from VA (lenders typically want 620+) | No PMI, limited to eligible veterans |
| USDA Loan | 0% (No down payment required) | 640+ for streamlined process | Property must be in eligible rural area |
Side-by-side comparisons help you choose between loan terms. For example, a 15-year loan saves more on interest than a 30-year loan. Dashboards show how each option affects your equity.
Fannie Mae caps total debt-to-income at 36 % for manually underwritten loans (up to 45 % with compensating factors) and at 50 % for Desktop Underwriter approvals—critical limits when stress-testing affordability. Ref.: “Fannie Mae. (2024). Debt-to-Income Ratios (Selling Guide B3-6-02). Fannie Mae.” [!]
Top tools use predictive modeling for Federal Reserve announcements. This helps you apply at the right time. Waiting for the “perfect” rate can be risky, as the Fed’s changes can affect rates.
Look for these key features in any mortgage rate comparison dashboard:
- Real-time rate updates from at least 20+ lenders
- Customizable alerts via text and email
- Filters for all major loan types (conventional, FHA, VA, USDA)
- Clear display of fees, points, and APR
- Ability to save scenarios for different loan options
Some dashboards work with mortgage brokers. They can negotiate for you when you find a good rate. This mix of tech and human help can get you a better rate.
When rates go up, dashboards with alerts let you know fast. This quick info helps you make smart choices, not just react to changes later.
Each loan type has its own benefits. VA loans don’t need a down payment, while FHA loans are flexible for those with lower credit scores. Your dashboard should show you these options based on your needs.
The amount you can borrow varies between lenders. Good dashboards help you find lenders that will approve your loan amount. This way, you avoid disappointment when you can’t get the loan you want.
Closing Cost Estimators Factoring Regional Differences
Closing costs can change a lot based on where you live. They can go from $6,000 to $18,000 on a $300,000 home. This big difference can affect your budget a lot.
Online calculators don’t always get it right. As a REALTOR®, I’ve seen buyers get surprised by how much their closing costs really are. The best tools take into account local taxes and fees.
Transfer taxes can change a lot just by crossing a county line. This can add up to $7,500 on a $300,000 home. Good closing cost estimators use local data to get it right.
To ensure you’re not overspending during your home purchase, How to avoid overspending on house purchase budget provides key tips.
County Specific Transfer Tax Lookups Simplified
Tools for looking up county transfer taxes make things easier. They get current rates from tax databases. This way, you get an accurate estimate for your area.
These tools can save you a lot of money. Last month, a client saved $3,200 by choosing the right county. This also helped in negotiations with the seller.
When using these tools, look for features that allow you to:
- Compare transfer tax rates across multiple counties
- Calculate exact tax amounts based on your home’s purchase price
- View historical tax rate changes to identify trends
- Generate printable reports for your lender and closing agent
State-level closing costs range from under 1 % to over 5 % of the purchase price, with Washington D.C. the highest and Missouri the lowest—confirm local figures before finalising funds. Ref.: “Bankrate Editorial Team. (2024). Average Closing Costs on a House in 2024. Bankrate.” [!]
Negotiation Tips Lowering Service Provider Fees
Many closing costs can be negotiated. Buyers who do this save an average of $1,200. This is money you can use for your down payment or emergency fund.
Good closing cost estimators show which fees can be negotiated. This includes lender fees, title services, and more. Many buyers don’t even think to ask.
Here are my tips for negotiating lower closing costs:
- Shop for title insurance – Rates can vary by hundreds of dollars between providers for identical coverage
- Request multiple quotes for home inspections – Prices typically range from $300-$600 for similar services
- Compare lender origination fees – These can often be reduced or waived, even with strong credit
- Ask about appraisal fee discounts – Some lenders offer reduced rates when bundled with other services
- Request seller concessions – In buyer’s markets, sellers often agree to cover a portion of closing costs
The best feature in closing cost estimators is making seller concession requests. These requests can increase acceptance rates. I’ve seen them save buyers 3-4% of the purchase price.
Sellers are more willing to negotiate closing costs today. A good request can make a big difference. Your estimator should help you know which costs are usually paid by the seller.
Remember, property taxes and insurance also add to your costs. They vary a lot by location. Good estimators use current rates for your property. Insurance costs also change based on local risks.
If you’re looking for essential tools to aid in your budgeting, Must have home buying budget tools for buyers is a valuable resource.
Cash Reserve Planners Validating Emergency Buffers
There’s more to buying a home than just the down payment. A cash reserve planner is key to keeping your finances safe. Many first-time buyers focus too much on the down payment. They forget about the money they’ll need later.
As a realtor, I’ve seen many buyers struggle after they buy a home. They worry about repairs because they spent all their savings on the down payment. Research shows 39% of first-time homeowners face big surprises in their first year.
A good cash reserve planner looks at a few important things. It considers the home’s age, its systems, and your income. This way of figuring out your emergency helps avoid financial stress.
The minimum reserve you need includes three months of housing payments. You also need 1% of the home’s value for repairs. For older homes, you might need more for repairs.
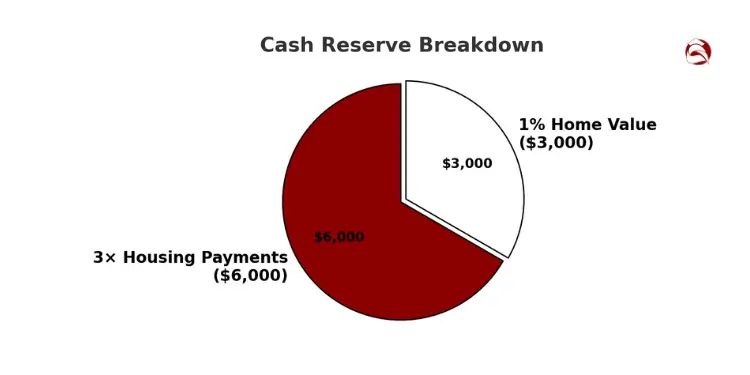
For example, a $300,000 home with $2,000 monthly payments needs:
- $6,000 for three months of housing payments
- $3,000 for repair contingencies (1% of home value)
- Total minimum reserve: $9,000
Emergency Fund Target Percentage Guide
Your emergency fund target changes based on your situation. The standard percentages vary a lot:
- Single-income households: 6+ months of total expenses
- Dual-income households: 3-4 months of total expenses
- Self-employed or commission-based income: 8-12 months of expenses
- Households with student loans or other debt payments: Add 2 additional months
Don’t forget to include insurance deductibles in your emergency fund. A client of mine had a $2,500 deductible for a $3,200 HVAC repair two months after buying. Without enough reserves, they would have had to use high-interest credit cards.
Today’s best reserve planners include plans for future repairs. They help you save for known expenses. For example, if your roof has 3-5 years left, you can save for its replacement.
Your financial situation affects how much you can afford and how happy you’ll be as a homeowner. A detailed look at home buying costs should include emergency reserves.
When working with first-time buyers, I tell them PMI is better than no emergency fund. Having cash when you need it is more important than saving on PMI.
Home maintenance is a must. Planning for these costs before buying helps you enjoy your home without worry.
For a comprehensive guide:
Debt To Income Calculators Assessing Eligibility
Lenders look at your debt-to-income ratio (DTI) more than your credit score. This ratio is your monthly debt payments divided by your monthly income. It’s shown as a percentage.
Good DTI calculators show two important parts. They look at your housing costs and all your debt payments. Conventional loans want your housing costs to be no more than 28% of your income. They also want your total debt to be no more than 36%.
I help clients see how paying off debts can help them qualify for more. One client paid off a $4,200 car loan. This helped them qualify for $35,000 more to buy a home.
Student loans can really affect how much home you can buy. FHA and conventional loans count student loans differently. A $50,000 student loan might cut your home buying power by about $75,000, according to research.
The best part of a DTI calculator is the “maximum purchase price” feature. It changes as you adjust your debt payments. It shows how much home you can buy, including property tax and insurance costs.
Start using these tools early in your home-buying journey. Buyers who improve their DTI before applying are 72% more likely to get approved. This saves time and protects your credit score from too many checks.


