
Best stock ticker websites
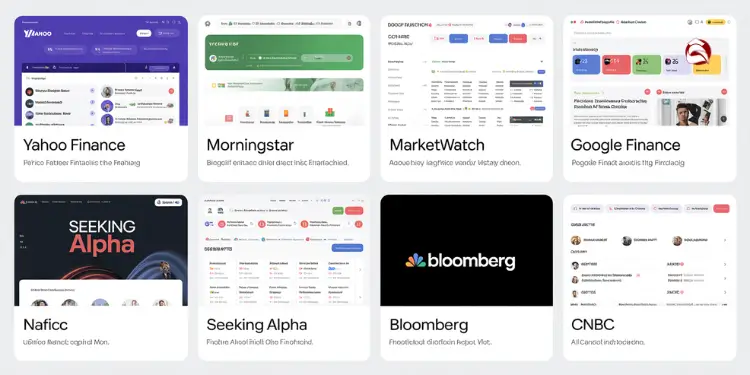
For beginners seeking reliable market data, these top stock ticker websites offer essential tools and insights. Each platform provides unique features to help new investors navigate the financial markets effectively.
| Website | Key Features | Cost | Best For |
|---|---|---|---|
| Yahoo Finance | Real-time quotes, news, portfolio tracking, basic analysis | Free | Beginners needing comprehensive free tools |
| Morningstar | In-depth research, analyst ratings, financial reports | Freemium | Investors seeking detailed fundamental analysis |
| MarketWatch | Market news, watchlists, economic data | Free | Staying updated with market news and trends |
| Google Finance | Simple interface, portfolio tracking, news aggregation | Free | Users preferring clean, straightforward design |
| Seeking Alpha | Crowd-sourced analysis, earnings calls, premium content | Freemium | Investors wanting diverse market perspectives |
| Bloomberg | Global market coverage, professional-grade data | Freemium | Those needing international market insights |
| CNBC | Breaking news, expert commentary, real-time quotes | Free | Following market-moving news and events |
Market Insight and Analysis Platforms
For investors seeking deeper market intelligence beyond basic tickers, specialized platforms offer advanced analytical tools and research capabilities. These services provide comprehensive market insights, technical analysis, and expert commentary to help investors make more informed decisions based on thorough market research and data interpretation.
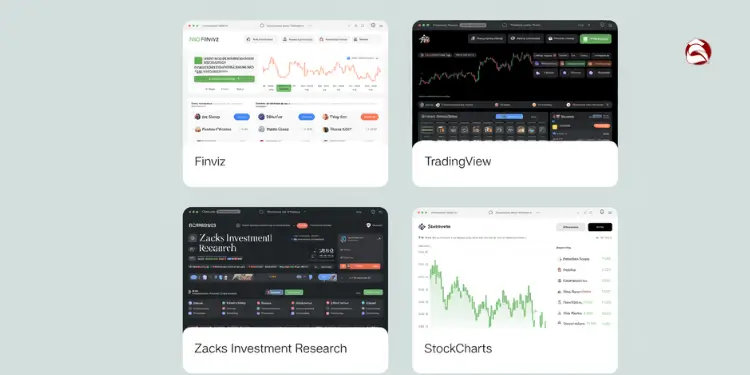
- Finviz – Offers powerful stock screeners, advanced charting tools, and market visualization maps that help investors identify trends and opportunities through detailed technical and fundamental analysis.
- TradingView – Provides sophisticated charting capabilities, social trading features, and real-time market data favored by technical analysts and active traders seeking detailed market visualization.
- Zacks Investment Research – Delivers earnings estimates, stock ratings, and comprehensive research reports based on their proprietary quantitative analysis methodology for investors focused on fundamental research.
- StockCharts – Specializes in technical analysis with extensive charting tools, market indicators, and educational resources for investors who rely heavily on technical analysis strategies.
Comparative Review of Leading Stock Tickers
When selecting the ideal stock ticker platform, investors must weigh various factors including data accuracy, analysis capabilities, and user experience. The following comparison highlights key differences between leading platforms to help beginners make informed decisions based on their specific needs and investment goals.
| Platform | Real-Time Data | Cost | User Interface | Analysis Tools |
|---|---|---|---|---|
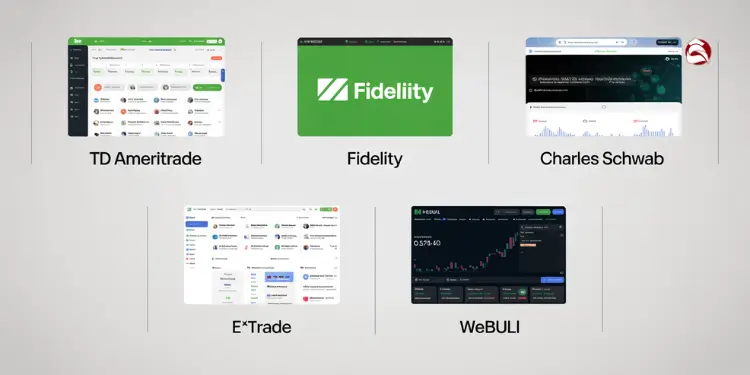
| TD Ameritrade | ✓ Premium | Free for clients | Professional | Advanced technical & fundamental |
| Fidelity | ✓ Comprehensive | Free for clients | Clean & intuitive | Robust research & screeners |
| Charles Schwab | ✓ Reliable | Free for clients | User-friendly | Strong research tools |
| E*TRADE | ✓ Fast streaming | Free for clients | Modern design | Technical analysis & research |
| Webull | ✓ Real-time | Free | Tech-focused | Advanced charting & indicators |
AI and Sentiment Analysis in Trading
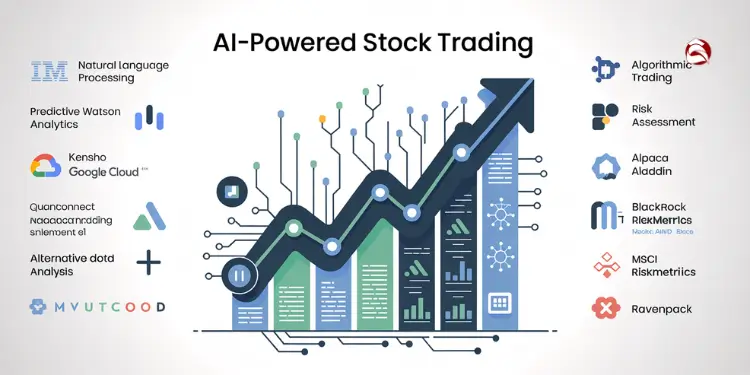
Artificial intelligence and sentiment analysis have revolutionized how investors approach stock trading, transforming vast amounts of unstructured data into actionable insights. These technologies enable traders to process market information at unprecedented speeds and scales, identifying patterns and opportunities that might otherwise remain hidden. By analyzing everything from news articles to social media posts, AI systems can gauge market sentiment and predict potential price movements with increasing accuracy.
- Natural Language Processing (NLP): Tools like IBM Watson and Google Cloud Natural Language analyze financial news, earnings reports, and social media to extract sentiment indicators and identify market-moving information before it impacts prices.
- Predictive Analytics: Platforms such as Kensho and Ayasdi use machine learning algorithms to identify historical patterns and forecast future stock performance based on multiple variables and market conditions.
- Algorithmic Trading: AI-powered systems like QuantConnect and Alpaca enable automated trading strategies that can execute orders in milliseconds based on predefined criteria and real-time market analysis.
- Risk Assessment: AI tools such as BlackRock’s Aladdin and MSCI’s RiskMetrics help investors evaluate portfolio risk by analyzing market correlations, volatility patterns, and potential downside scenarios.
- Alternative Data Analysis: Platforms like Quandl and RavenPack process unconventional data sources including satellite imagery, credit card transactions, and web traffic to generate unique investment insights.
Sentiment analysis of Twitter posts achieves nearly 90% accuracy in predicting stock movements, with accuracy increasing from 60% to 85% when expanding tweet data from 3,200 to 20,000 posts. Ref.: “AIMultiple Research Team. (2023). Sentiment Analysis Stock Market: Sources and Challenges. AIMultiple.” [!]
Criteria for evaluating website interfaces

Clean layouts for easy scanning
A clean, intuitive layout is essential for stock ticker websites. Cluttered interfaces overwhelm new investors and hinder information scanning. The best platforms use clear fonts and concise data presentation, making key information like stock quotes and analyst ratings easily accessible.
Mobile responsiveness for on the go
Mobile responsiveness is crucial in today’s fast-paced world. Investors need to access stock quotes and financial news anywhere. The best platforms offer seamless mobile experiences that adapt to various screen sizes, enabling investors to monitor portfolios and make informed decisions on the go.
Mobile has surpassed desktop for online traffic at 53.3%, with 70% of users reporting positive feedback when financial sites appear properly on mobile devices. Ref.: “Onsharp Development Team. (2023). 5 Reasons Why Your Banking Website Must Be Mobile Responsive. Onsharp.” [!]
Depth and freshness of market coverage
Comprehensive, up-to-date market coverage is essential for evaluating stock ticker websites. Investors need real-time data and the latest financial news. Top platforms cover a wide range of securities and update data feeds frequently, ensuring investors have access to current market information.
Quality real-time data is essential for making informed trading decisions, with institutional-grade accuracy licensed directly from exchanges being the gold standard for professional platforms. Ref.: “Bright Data Research Team. (2025). Top 5 Stock Data Providers of 2025: Features, Pricing & More. Bright Data.” [!]
Advertisement intrusion and page load speed
Comparative analysis of customization tools
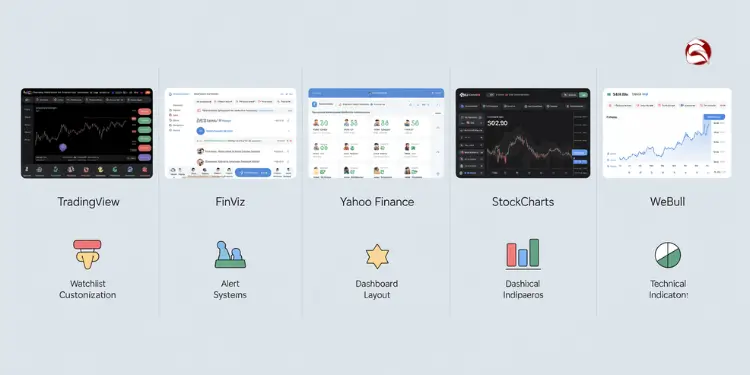
Customization capabilities are essential for investors seeking personalized market experiences, allowing them to tailor data displays, alerts, and watchlists to their specific investment strategies. The following comparison evaluates how leading platforms approach customization, helping beginners identify which tools best align with their individual trading preferences and monitoring needs.
| Platform | Watchlist Customization | Alert Systems | Dashboard Layout | Technical Indicators |
|---|---|---|---|---|
| TradingView | ✓ Unlimited lists with tags | ✓ Price, volume, technical alerts | ✓ Fully customizable widgets | ✓ 100+ indicators |
| Finviz | ✓ Multiple screeners & filters | ✓ Email alerts for screeners | ✓ Grid/table customization | ✓ 60+ technical indicators |
| Yahoo Finance | ✓ Multiple portfolios | ✓ Price & news alerts | ✓ Modular dashboard | ✓ Basic indicators |
| StockCharts | ✓ Chart-based watchlists | ✓ Technical condition alerts | ✓ Chart layout presets | ✓ 300+ indicators |
| Webull | ✓ Custom watchlists | ✓ Real-time push notifications | ✓ Drag-and-drop interface | ✓ 50+ technical indicators |
Customizable layouts and shortcuts in trading apps help traders access preferred tools quickly, enhancing decision-making speed and reducing interface clutter for beginners. Ref.: “Itexus Development Team. (2023). Customization in Trading Apps: Tailoring the Trading Experience to User Needs. Itexus.” [!]
Building personalized portfolios watchlists quickly
Efficient portfolio and watchlist creation is crucial for investors who want to track multiple securities and monitor their investments effectively. The right personalization tools can streamline this process, allowing beginners to organize their market data and investment strategies with minimal effort.
- One-Click Watchlist Creation: Quickly add stocks to custom watchlists with single-click functionality
- Bulk Import Features: Upload multiple tickers simultaneously via CSV files or spreadsheet imports
- Template Portfolios: Pre-built portfolio templates based on investment themes (dividend, growth, value)
- Drag-and-Drop Organization: Easily reorder and categorize watchlists by sector, performance, or personal preference
- Auto-Sync Portfolios: Automatically sync brokerage accounts to reflect current holdings in real-time
- Quick Filter Options: Instantly filter watchlists by price changes, volume, or market cap
- Mobile Sync: Seamlessly access and update watchlists across desktop and mobile devices
Top recommended beginner niceticker sites
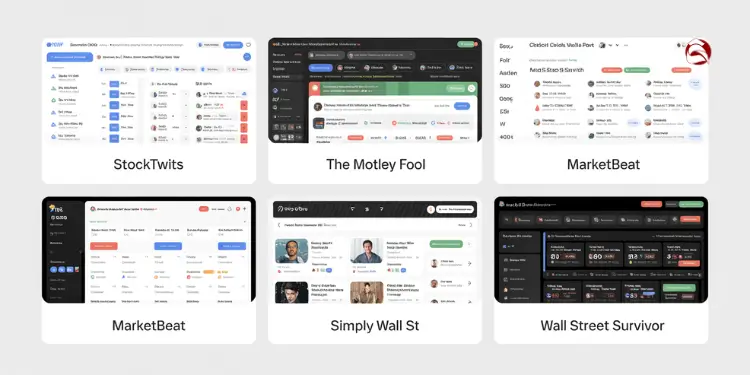
For investors just starting their journey, these accessible platforms offer unique features and user-friendly interfaces designed specifically to help newcomers navigate the stock market with confidence:
- StockTwits – Social media platform for investors that combines real-time ticker data with community insights and discussions
- The Motley Fool – Investment advice and market data with educational content focused on long-term investing strategies
- MarketBeat – Simple interface with stock ratings, analyst recommendations, and earnings calendar for beginners
- Simply Wall St – Visual approach to stock analysis with easy-to-understand infographics and fundamental data
- Wall Street Survivor – Virtual trading platform that allows beginners to practice investing with fake money while learning real market skills
“Related Articles: Realistic vs Unrealistic Investment Goals for Beginners“


